Evaluating Environmental Justice Problems in Los Angeles County
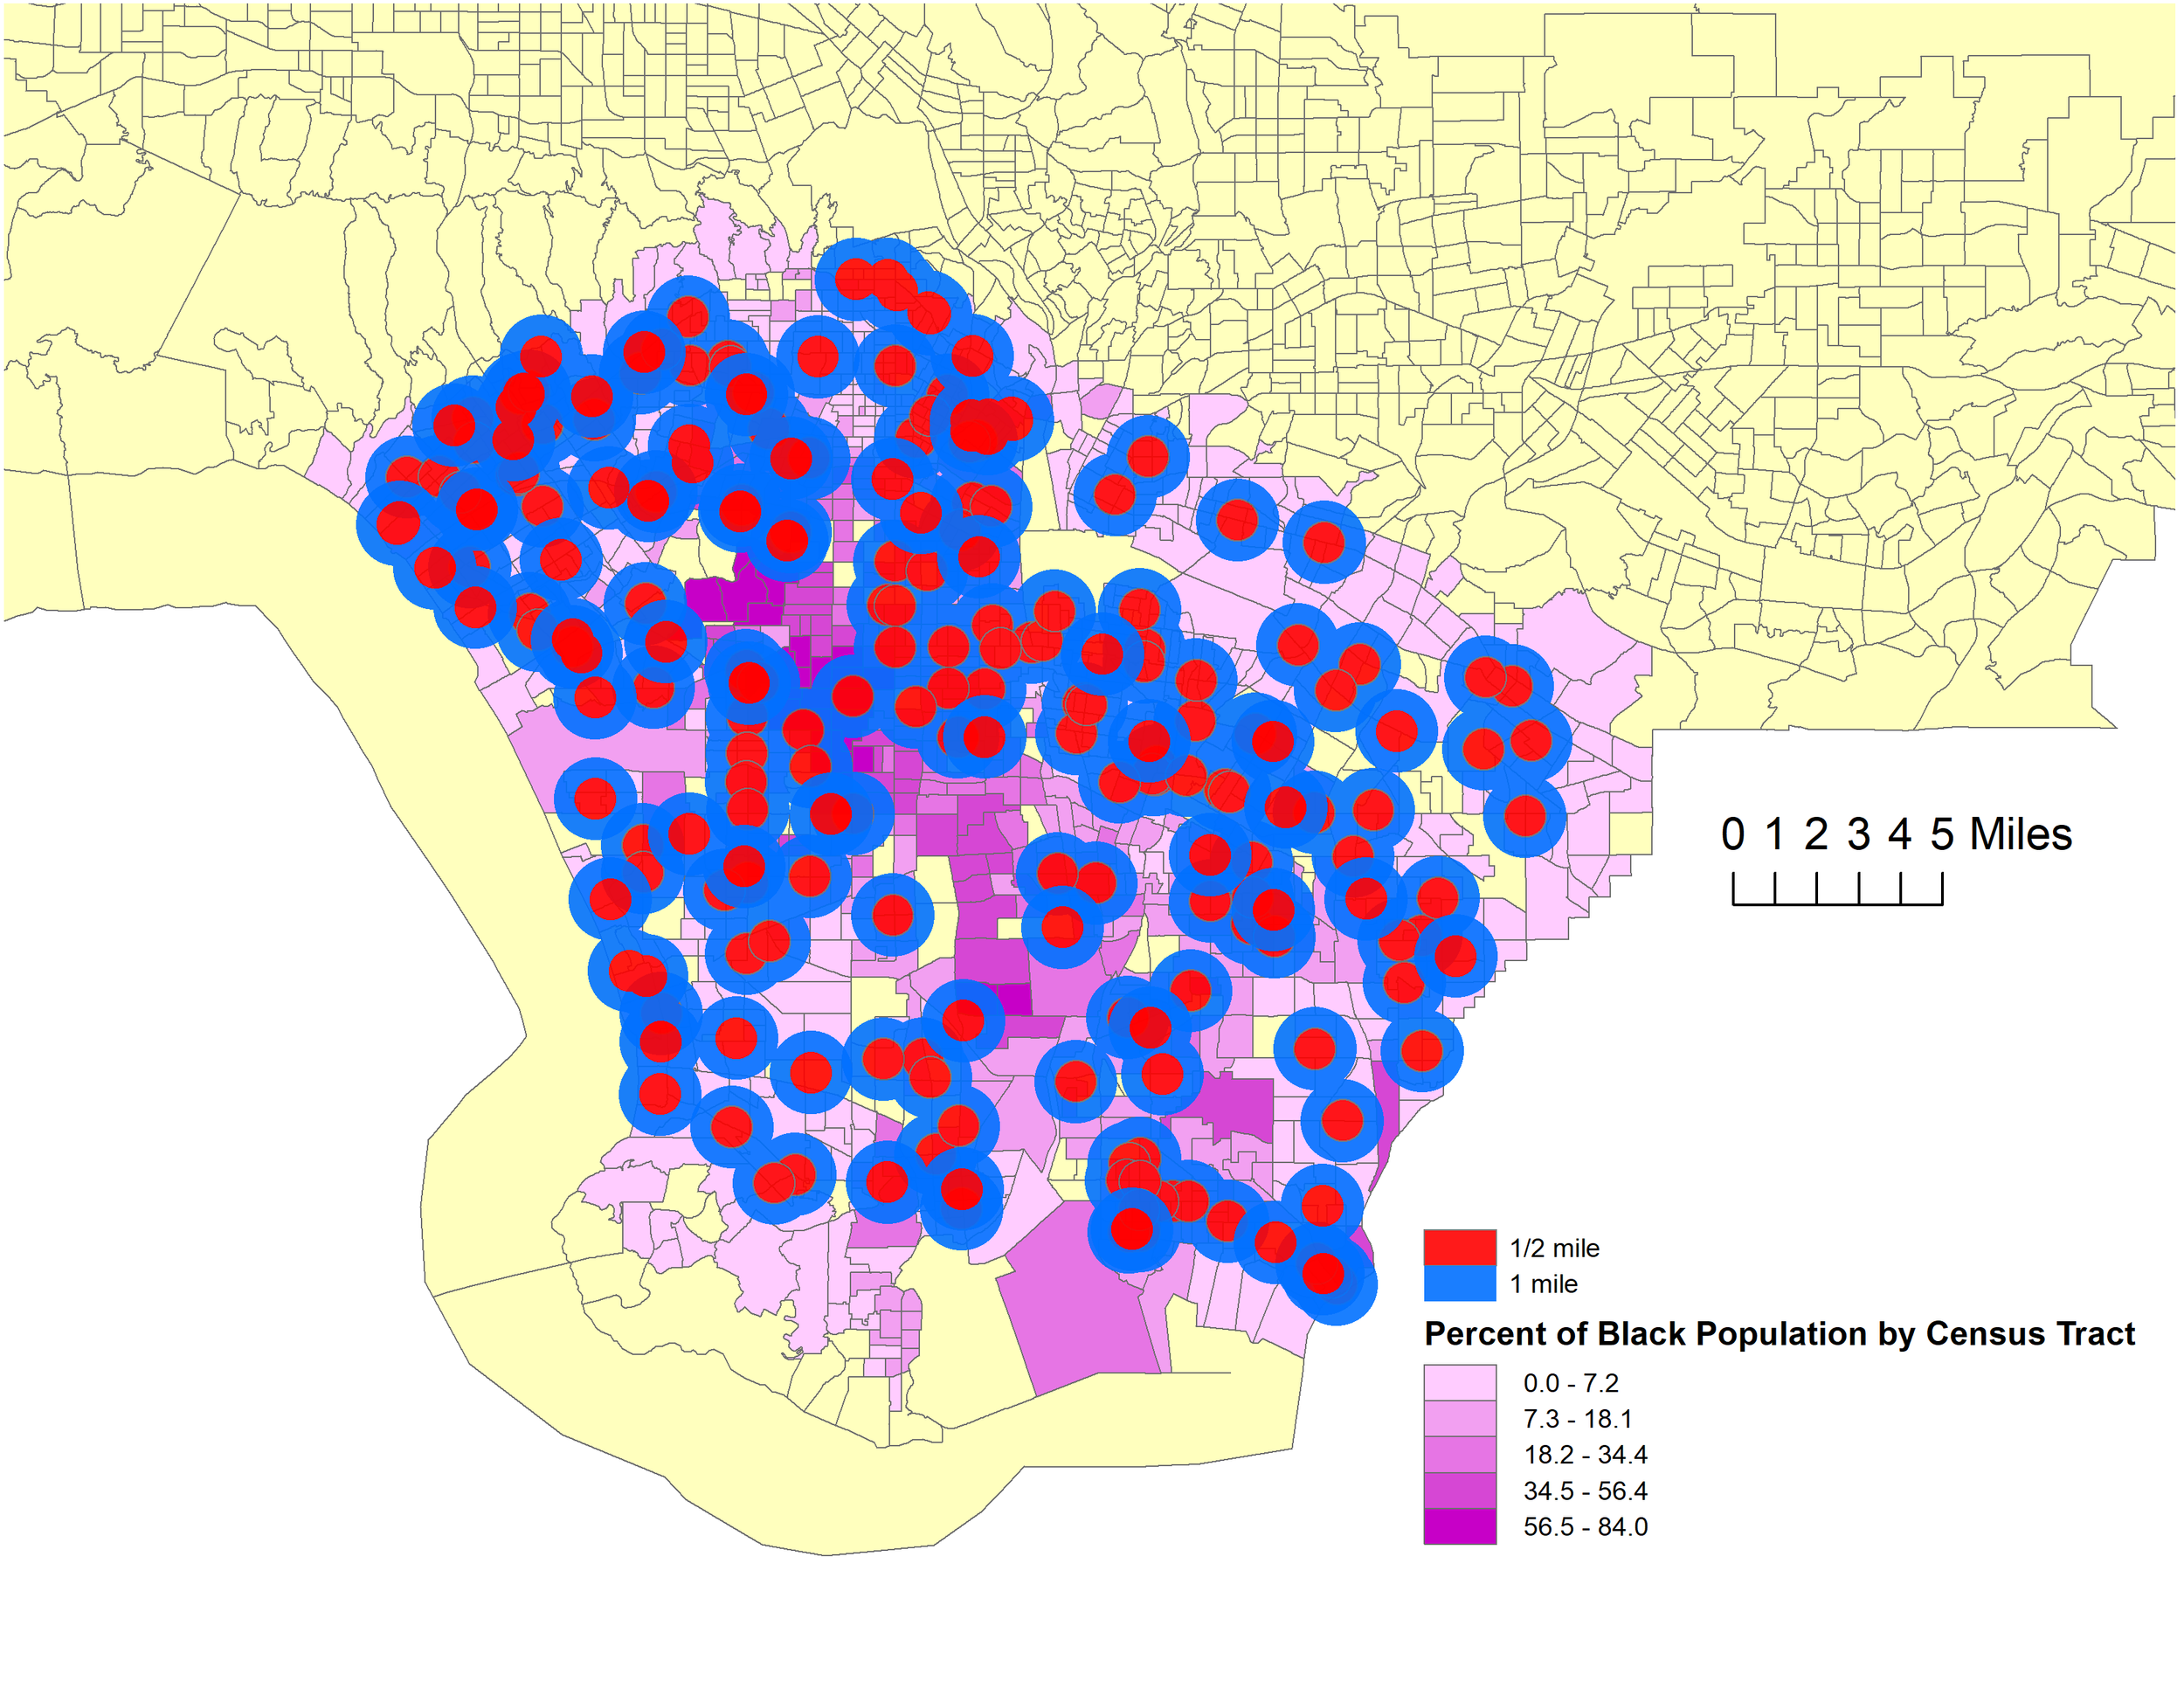
Multi-ring buffer of Supermarkets in Greater LA Area
Overlayed over choropleth map of proportion of black people by census tract
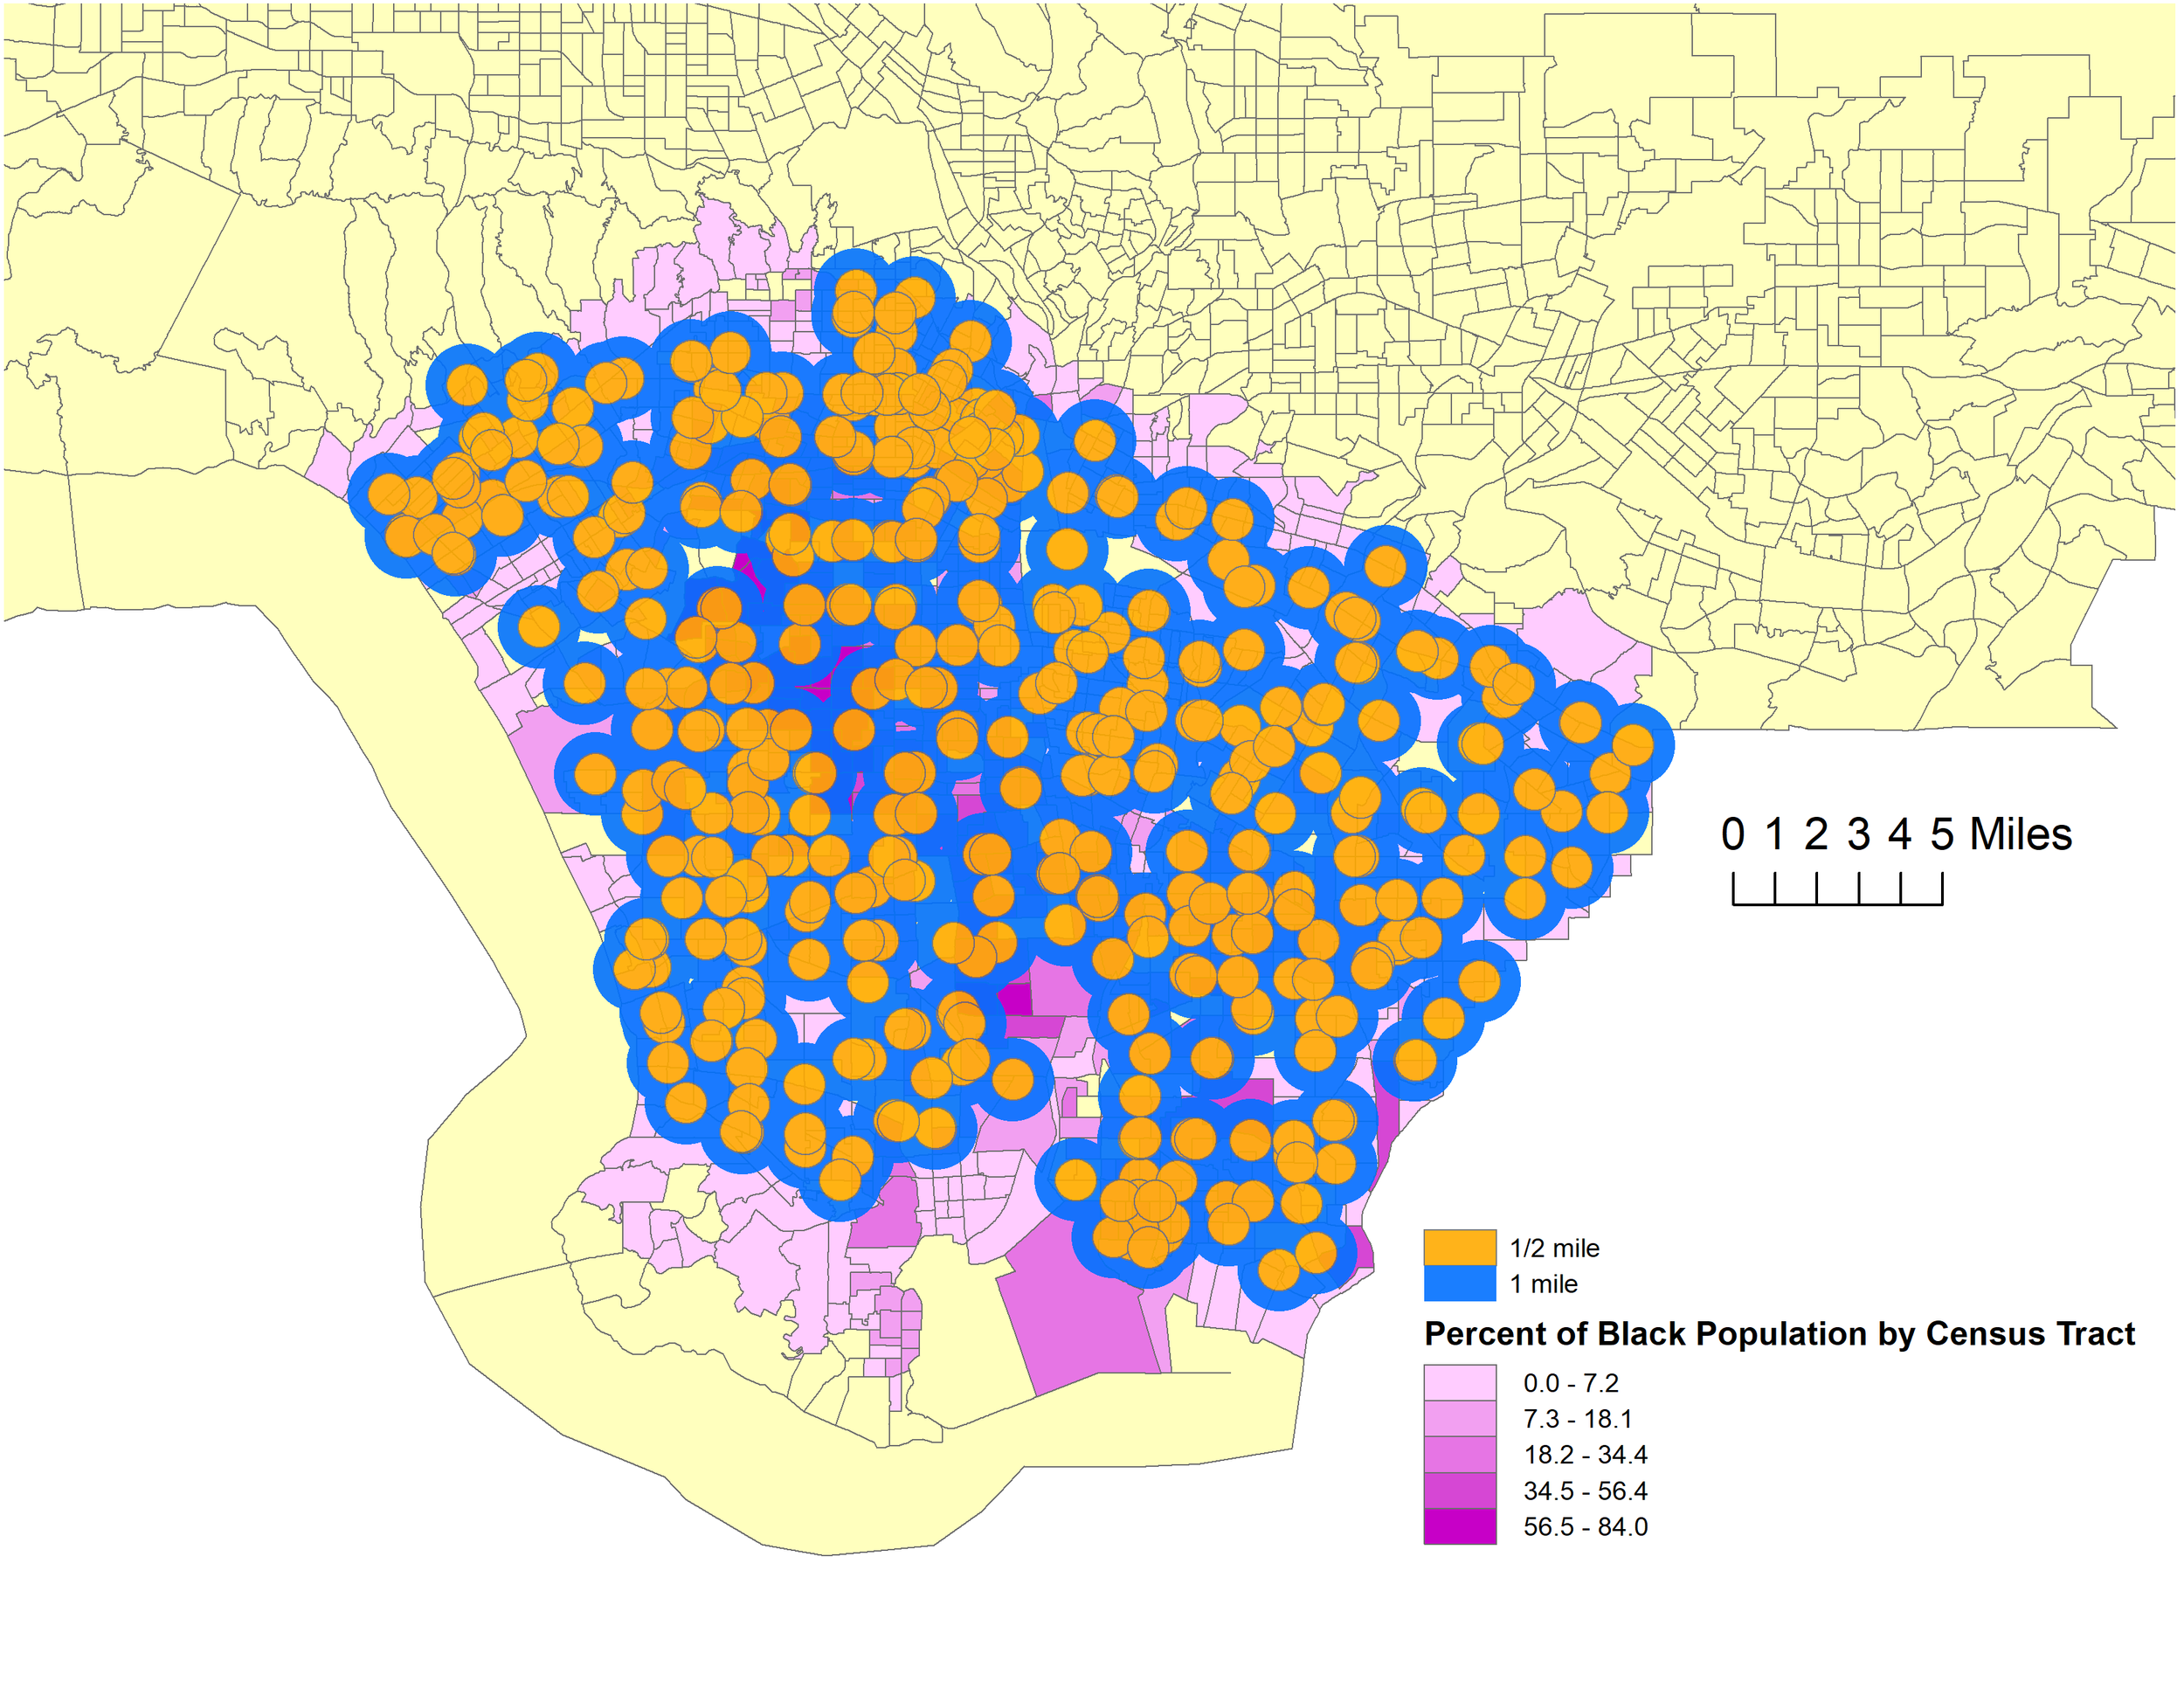
Multi-ring buffer of fast food restaurants (top 5 chains) in Greater LA area
Overlayed over choropleth map of proportion of black people by census tract
Phase 1: Introduction
The goal of the first phase of this research project was to further understand the distribution of farmers markets—and in addition supermarkets in Los Angeles county with respect to different demographic factors, the population at large, and fast food restaurants. The main motivation for scientifically addressing this question is as someone who grew up in a low-income community in Los Angeles (LA), I did not know what farmers markets were until I went to my undergraduate institution; this is because they never occurred in my community or any neighboring areas, and so I want to further highlight and understand the access to fresh produce in general. Hence, the research question breaches the food justice domain.
Note: Data was independently harvested and scraped from various online services
As an initial visualization, I found it necessary to visualize the distribution of supermarkets and fast food chains overlaid over a vulnerable group in LA such as the black population. In visualizing the topography, it is clear that there are areas in central LA that have no supermarkets for several miles and incidentally enough these census tracts also have a higher percentage of black people. This showcases how an underrepresented group in LA is more prone to food deserts—making access to fresh produce a struggle that is exacerbated without a personal vehicle.
Phase I: Exploratory Analysis

Map of supermarkets, fast food chains (top 5), and farmers markets in the greater LA area
Phase I: Statistical Analysis
A spatial join was constructed between data sets to construct two new response variables—that is ‘distance to nearest farmers market’ and ‘count of farmers market in census tract’. Selected explanatory variables consisted of demographic variables.
A linear model was used to study the continuous response variable ‘distance to nearest farmers market’
A generalized linear model with a Poisson distribution and a logarithm link function was used to study the response variable ‘count of farmers market in census tract’ due to it’s discrete, non-negative data structure.


Hypothesis testing and parameter estimation were conducted by analyzing each model to understand which variables were statistically significant and for coefficient analysis.
Phase I: Results/Discussion
In undertaking this project, the goal was to map the food landscape of central and southern Los Angeles county, in particular mapping the spatial distribution of farmers markets, supermarkets, and fast food restaurants. That was accomplished, but more interestingly, demographic factors were factored into our spatial analysis, and highlighted census tracts that were farther than 1 mile away from the nearest farmers market or supermarket had a high percentage of the black population. Additionally, it was clear that fast food restaurants are a plethora compared to fresh produce options, revealing a decreased access to healthy food options. Visual analyses was supplemented and further studied via statistical modeling. This highlights an interesting shift in the discussion of ‘food deserts’. Usually, food deserts are discussed in the concept of low income individuals, however, it is just as imperative to discuss racial factors as well. This is where intersectionality is an important concept to keep in mind, and helps illuminate that the concept of food deserts are not beholden to factors of only class and income, but also to racial and ethnic elements as well—a concept often forgotten.
Phase II: Introduction
Exploring the theme of environmental justice, the goal of the second phase of this research project was to delve further into the environmental disparities of LA. In particular, to understand the connection between demographic factors, the key locations titled Toxic Release Inventory (TRI) sites by the EPA, and pollution burden overall. The main motivation is to uncover spatial features that could lead to environmental inequalities, and to understand what specific areas are effected by pollution, but also may exhibit adverse health effects because of it.
Phase II: Exploratory Analysis
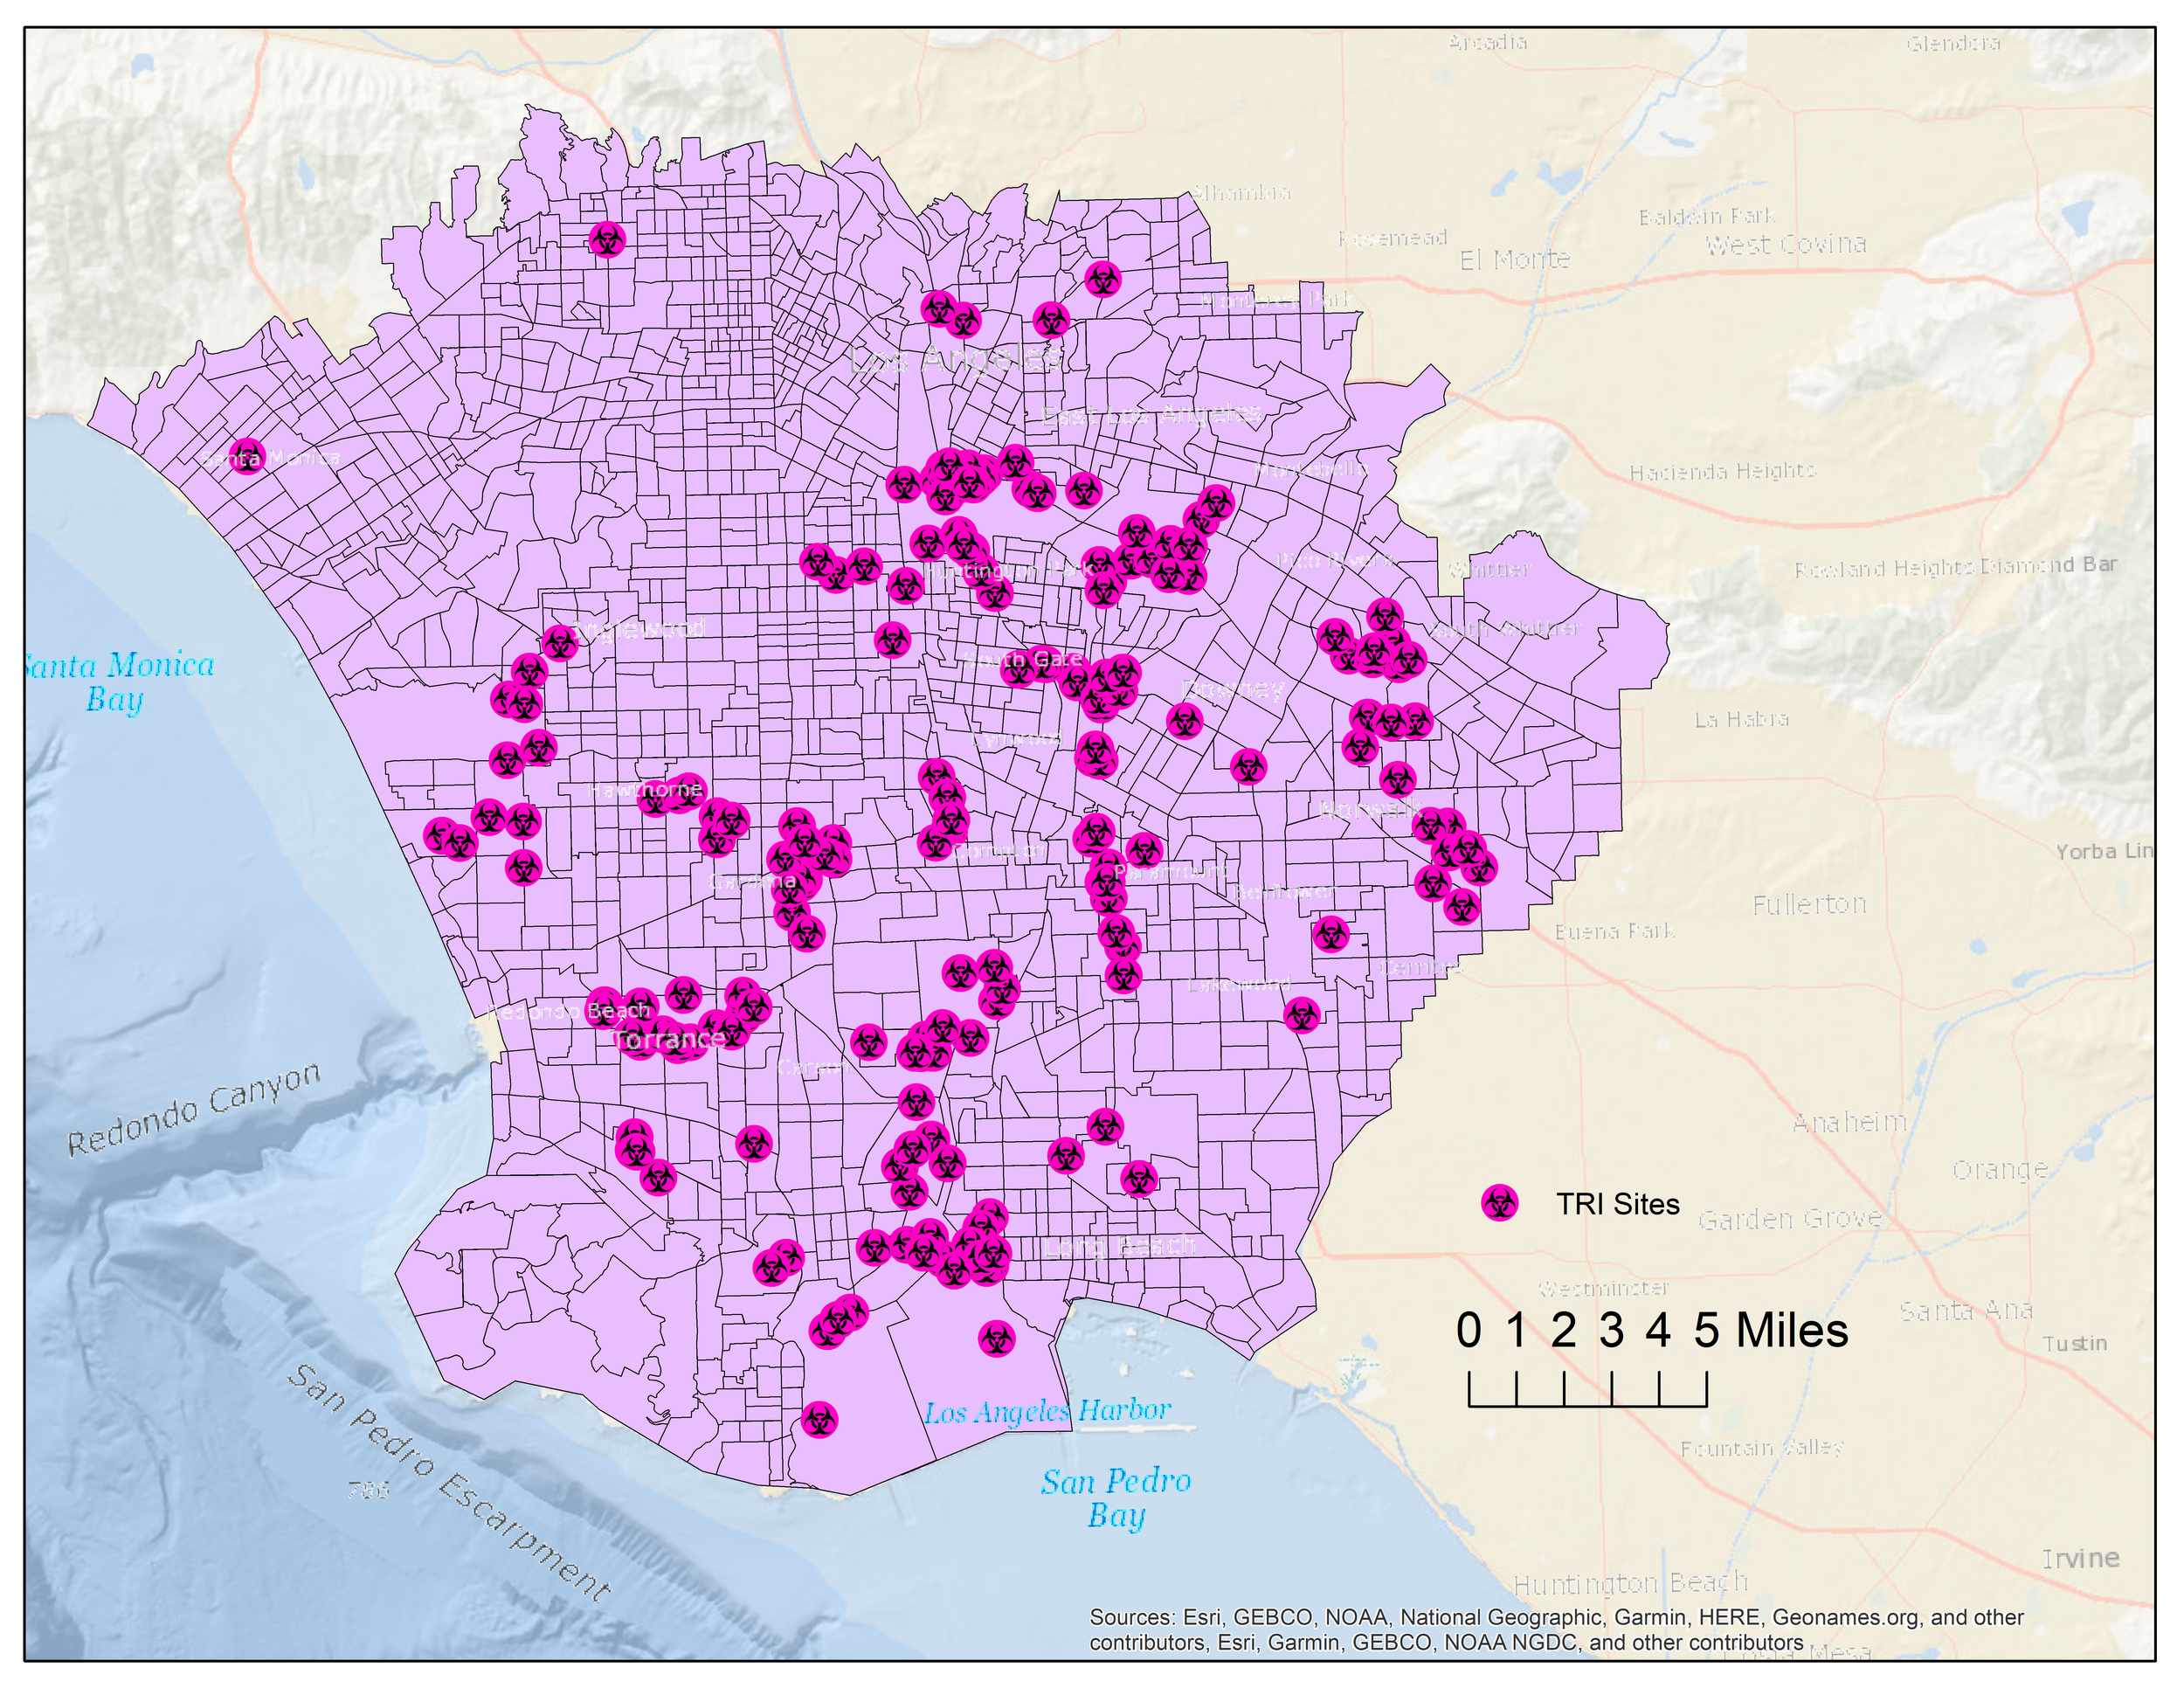
Map of TRI sites in Central-Southern LA


Map of TRI sites overlaid choropleth map of percentage of Latino population by census tract

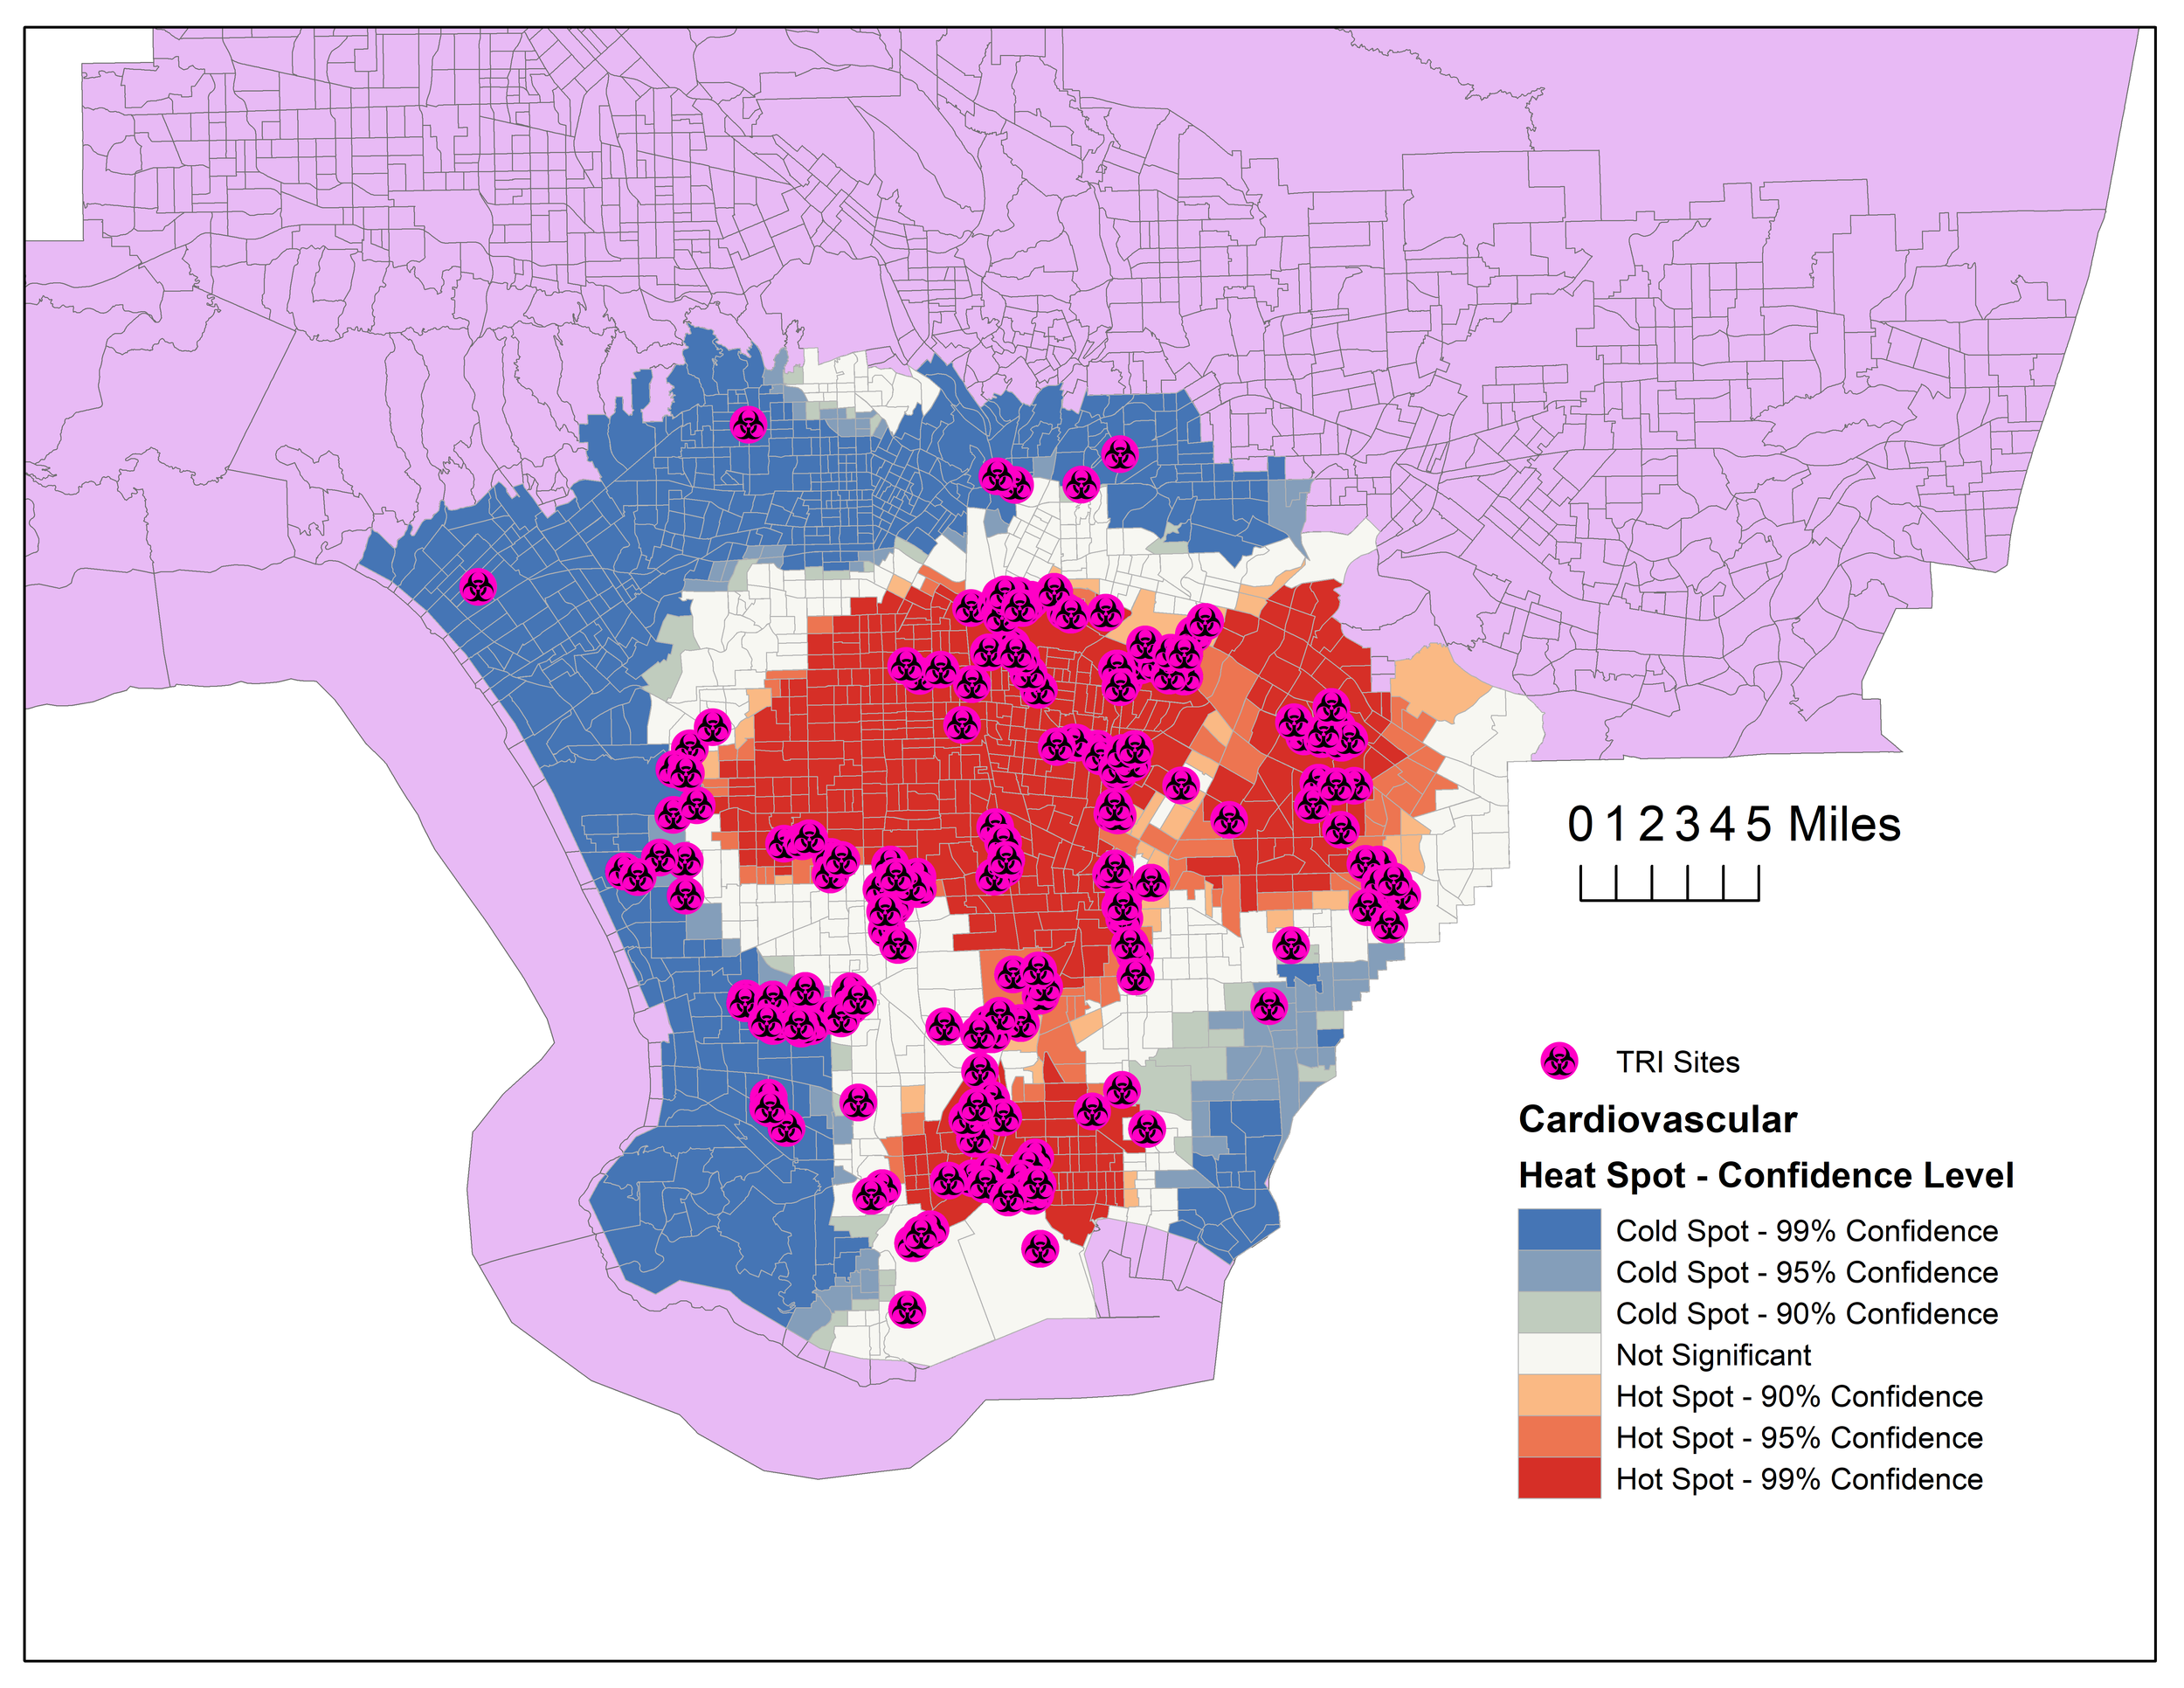
Heat map of statistically significant hot/cold spots of ER visits due to
Map of TRI sites overlaid choropleth map of percentage of white population by census tract
Phase II: Spatial/Statistical Analysis
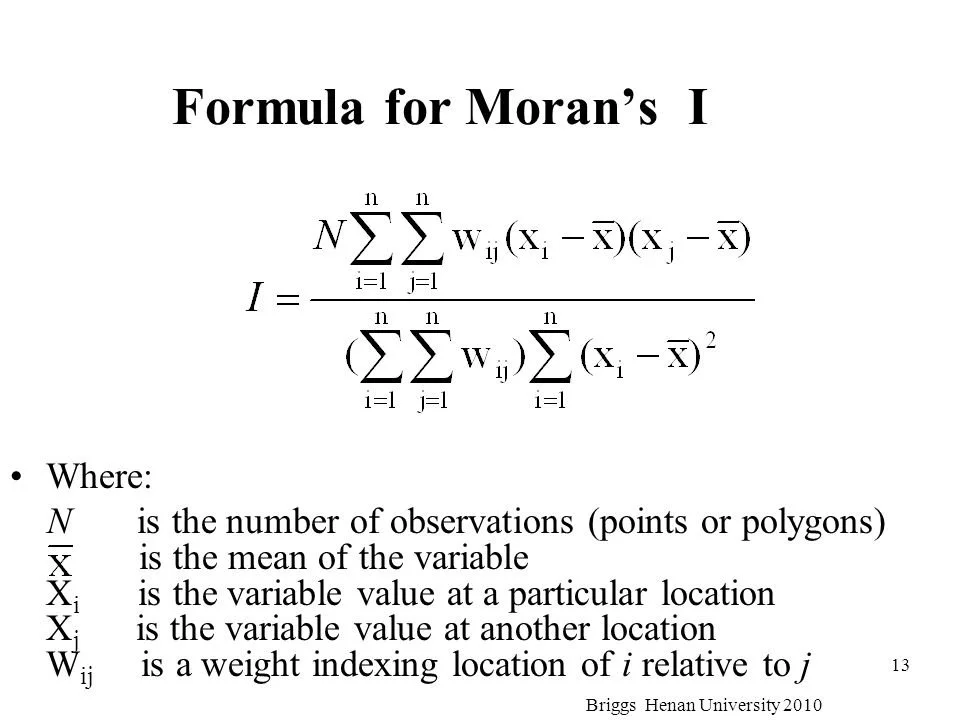
Global Moran’s Index
Phase II: Results/Discussion
Heat map of statistically significant hot/cold spots of ER visits due to asthma
As an initial visualization, I found it necessary to visualize the distribution of TRI sites as well as the percentage of an typical underrepresented group of people such as the Latino population compared to an overrepresented group of people such as the white population. An inspection of the images above yields a disturbing result, TRI sites happen to be clustered around sites where the percentage of Latino’s is highest. On the other hand, looking at the map of the percentage of white population by census tract it is clear that densly populated areas of white people have less TRI sites in their midst.
To further visualize and analyze how the LA region topography is laid out, a heat spot analysis was constructed to study the statistically significant hot spots and cold spots of asthma and cardiovascular related emergency room (ER) visits in central/southern LA. Studying the images below, a disturbing trend arises—we notice that the hot spots of asthma and cardiovascular ER visits are focused around the census tracts that have the highest percentage of Latinos. While the cold spots of asthma and cardiovascular ER visits are focused around the census tracts that have the highest percentage of white people. This brings forward the claim that underrepresented groups such as Latinos are prone to more health related
Heat Spot Analysis
Spatial autocorrelation was assessed with global moran’s I to assess the spatial distribution of three variables of interests: pollution burden, asthma related ER visits, and cardiovascular ER visits. Hypothesis tests were assessed and it was determined that pollution burden, asthma related ER visits, and cardiovascular ER visits are spatially clustered in a non-random fashion.
Linear Model
Spatially joining data sets and constructing a new variable including distance from census tracts to TRI sites allows the construction of a robust linear model taking in valuable explanatory variables constructed below.

In undertaking the project, the goal was to spatially assess the pollution burden of central Los Angeles as defined by the California OEHHA, and health conditions such as asthma and heart attacks. These processes were spatially and statistically analyzed with the use of Global Morans I to conclude that pollution burden, asthma, and heart attacks are spatially clustered and not random processes. Utilizing heat spot analyses revealed that hot spots and cold spots of pollution burden tend to overlap with hot spots and cold spots of asthma and heart attack related emergency department visits respectively. Indicating that the pollution burden of a census tract may be a strong indicator of adverse health effects. Additionally, the census tracts with the highest pollution burden also had the highest Latino population.
To expand the pool of explanatory variables and to facilitate analyses of TRI sites; distance to TRI sites was found to be statistically significant when predicting pollution burden, asthma, and cardiovascular disease. These results indicated that there is a predictive connection when it comes to the spatial distribution of TRI sites and pollution burden, asthma, and cardiovascular disease. Although mapping the environmental inequities present in LA is complex and there are multitudes of confounding variables not considered in this study, this research succeeded in visualizing one of the environmental inequities of Los Angeles. This was a study of the statistical and spatial relationship of TRI sites and demographic data coupled with poorer environmental quality and adverse health effects.