Bayesian Projects
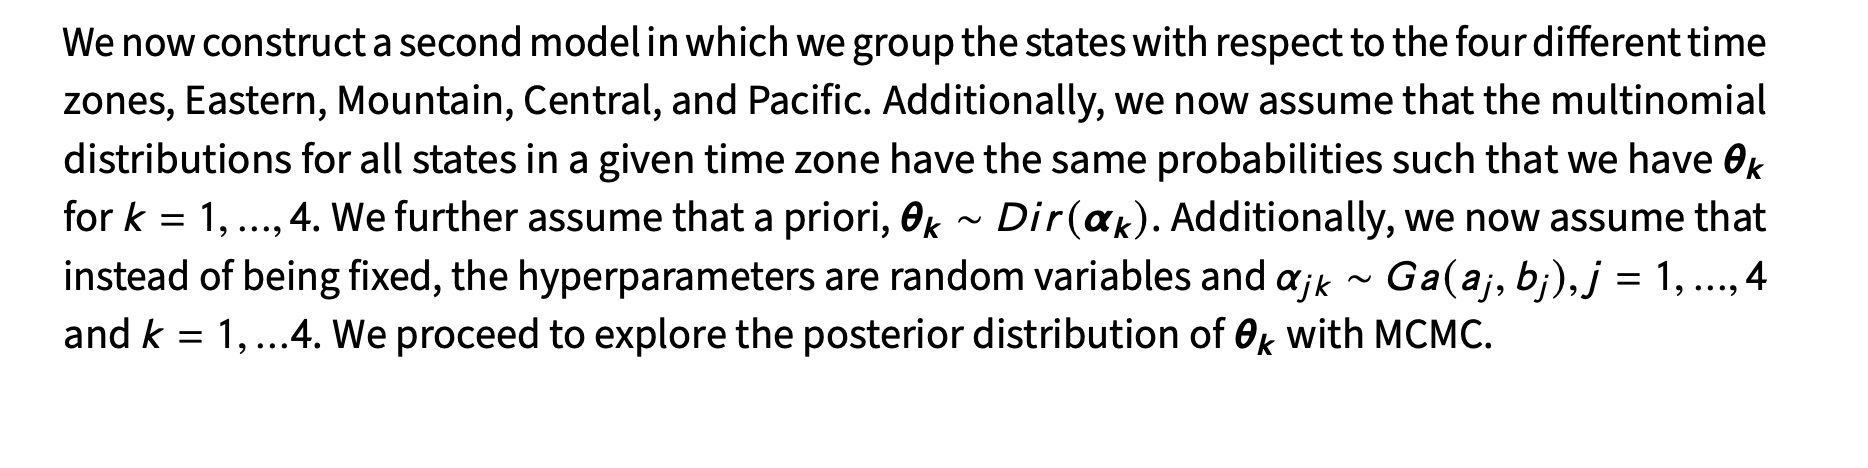
Project I: Analysis of COVID-19 Vaccine Counts
COVID-19 has brought upon a pandemic in the United States that has been entirely detrimental to human life. To help lessen the loss of life vaccines have been formulated to combat COVID-19. In this analysis, we are interested in understanding the distribution of four different vaccines across different states and time zones. We consider two modeling frameworks—model 1 considers a probability distribution for COVID-19 vaccines for each state. Model 2 considers the same probability distribution for COVID-19 vaccines across states in the same time zone. Posterior samples were estimated directly from the posterior distribution in model 1, and a Metropolis-within-Gibbs (MWG) algorithm was used for estimating our posterior samples in model 2. Analysis of the predictive model checks suggest the preference for model 2. More quantitatively, the posterior predictive loss criteria (PPLC) was calculated for each model, indicating support for model 2.
Project I: Abstract
Exploratory Data Analysis I


To begin with a successful analysis, EDA is vital to understand the layout of the data we are working with. Inspecting figure 1 and comparing the vaccine counts between Pfizer and Janssen, we recognize that there is a consistent set of states that appear to be outliers when compared to the rest and those are California, Texas, New York, and Florida. Inspecting figure 2, we recognize a similar trend among the outlier states. We notice that Moderna has the highest counts in California, New York, Texas and Florida, while the unknown vaccine is mostly popular in Hawaii and Florida. Visualizing the vaccine counts in this fashion helps define a clearer picture of the states that may be important for our analyses, and the states most relevant to each class of vaccine.
Figure 1: Pfizer and Janssen vaccine count across all states
Figure 2: Moderna and Unknown vaccine count across all states
Statistical Modeling and Analysis I


Posterior distribution of Pfizer and Moderna vaccine counts per state
Posterior distribution of Janssen and Unknown manufacturer vaccine counts per state
In the visualizations above we notice the difference between the posterior distributions of the vaccine counts of different states for each vaccine. Particular standouts are that we notice that Hawaii and South Carolina favor Pfizer, Mississippi and Montana favor Moderna, Maine and DC favor Janssen, and the unknown manufacturer is most popular in Hawaii.


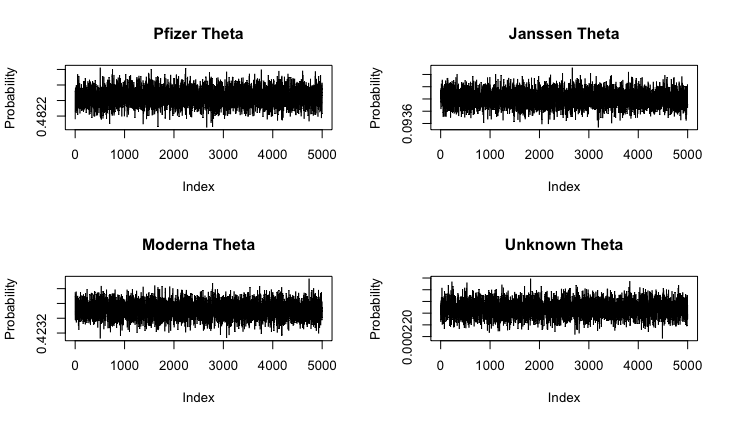
We proceed with sampling of our posterior distribution and then compare both models with established model comparison criteria such as DIC and PPLC. Convergence was checked with traceplots of the Markov chains. Through our model comparison criteria, we come to the conclusion that model 2 is more robust due to the extra complexity by creating a hierarchical modeling structure.

Pacific time zone traceplots

Eastern time zone traceplots
Central time zone traceplots

Mountain time zone traceplots